Correlation
MATH 4720/MSSC 5720 Introduction to Statistics
Scatterplots
- Describe the overall pattern
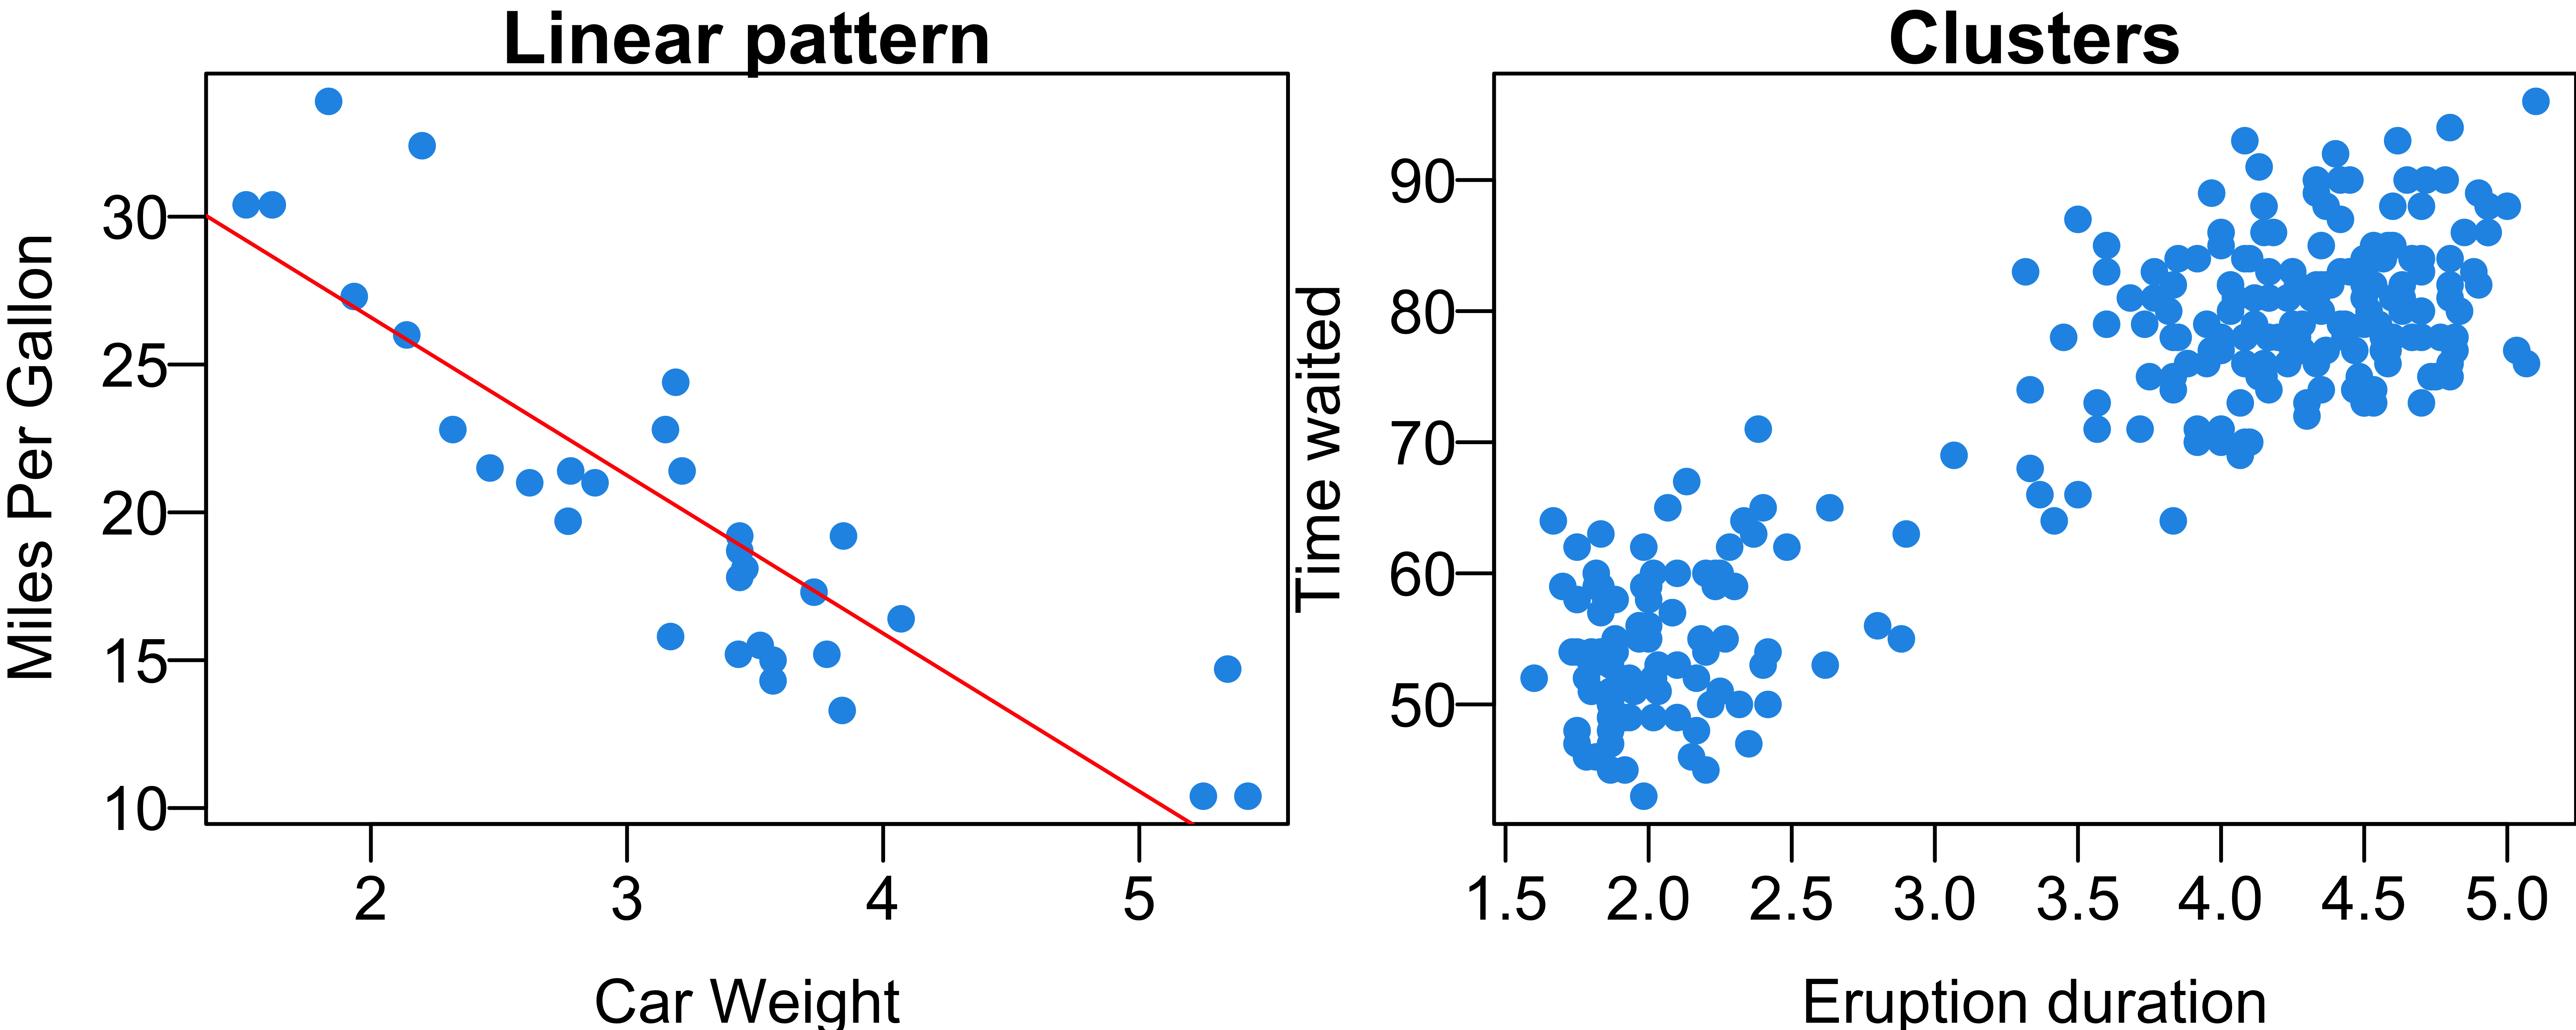
- Form: linear or clusters
- Direction: positively associated or negatively associated
- Strength: how close the points lie to a line/curve
Linear Correlation Coefficient
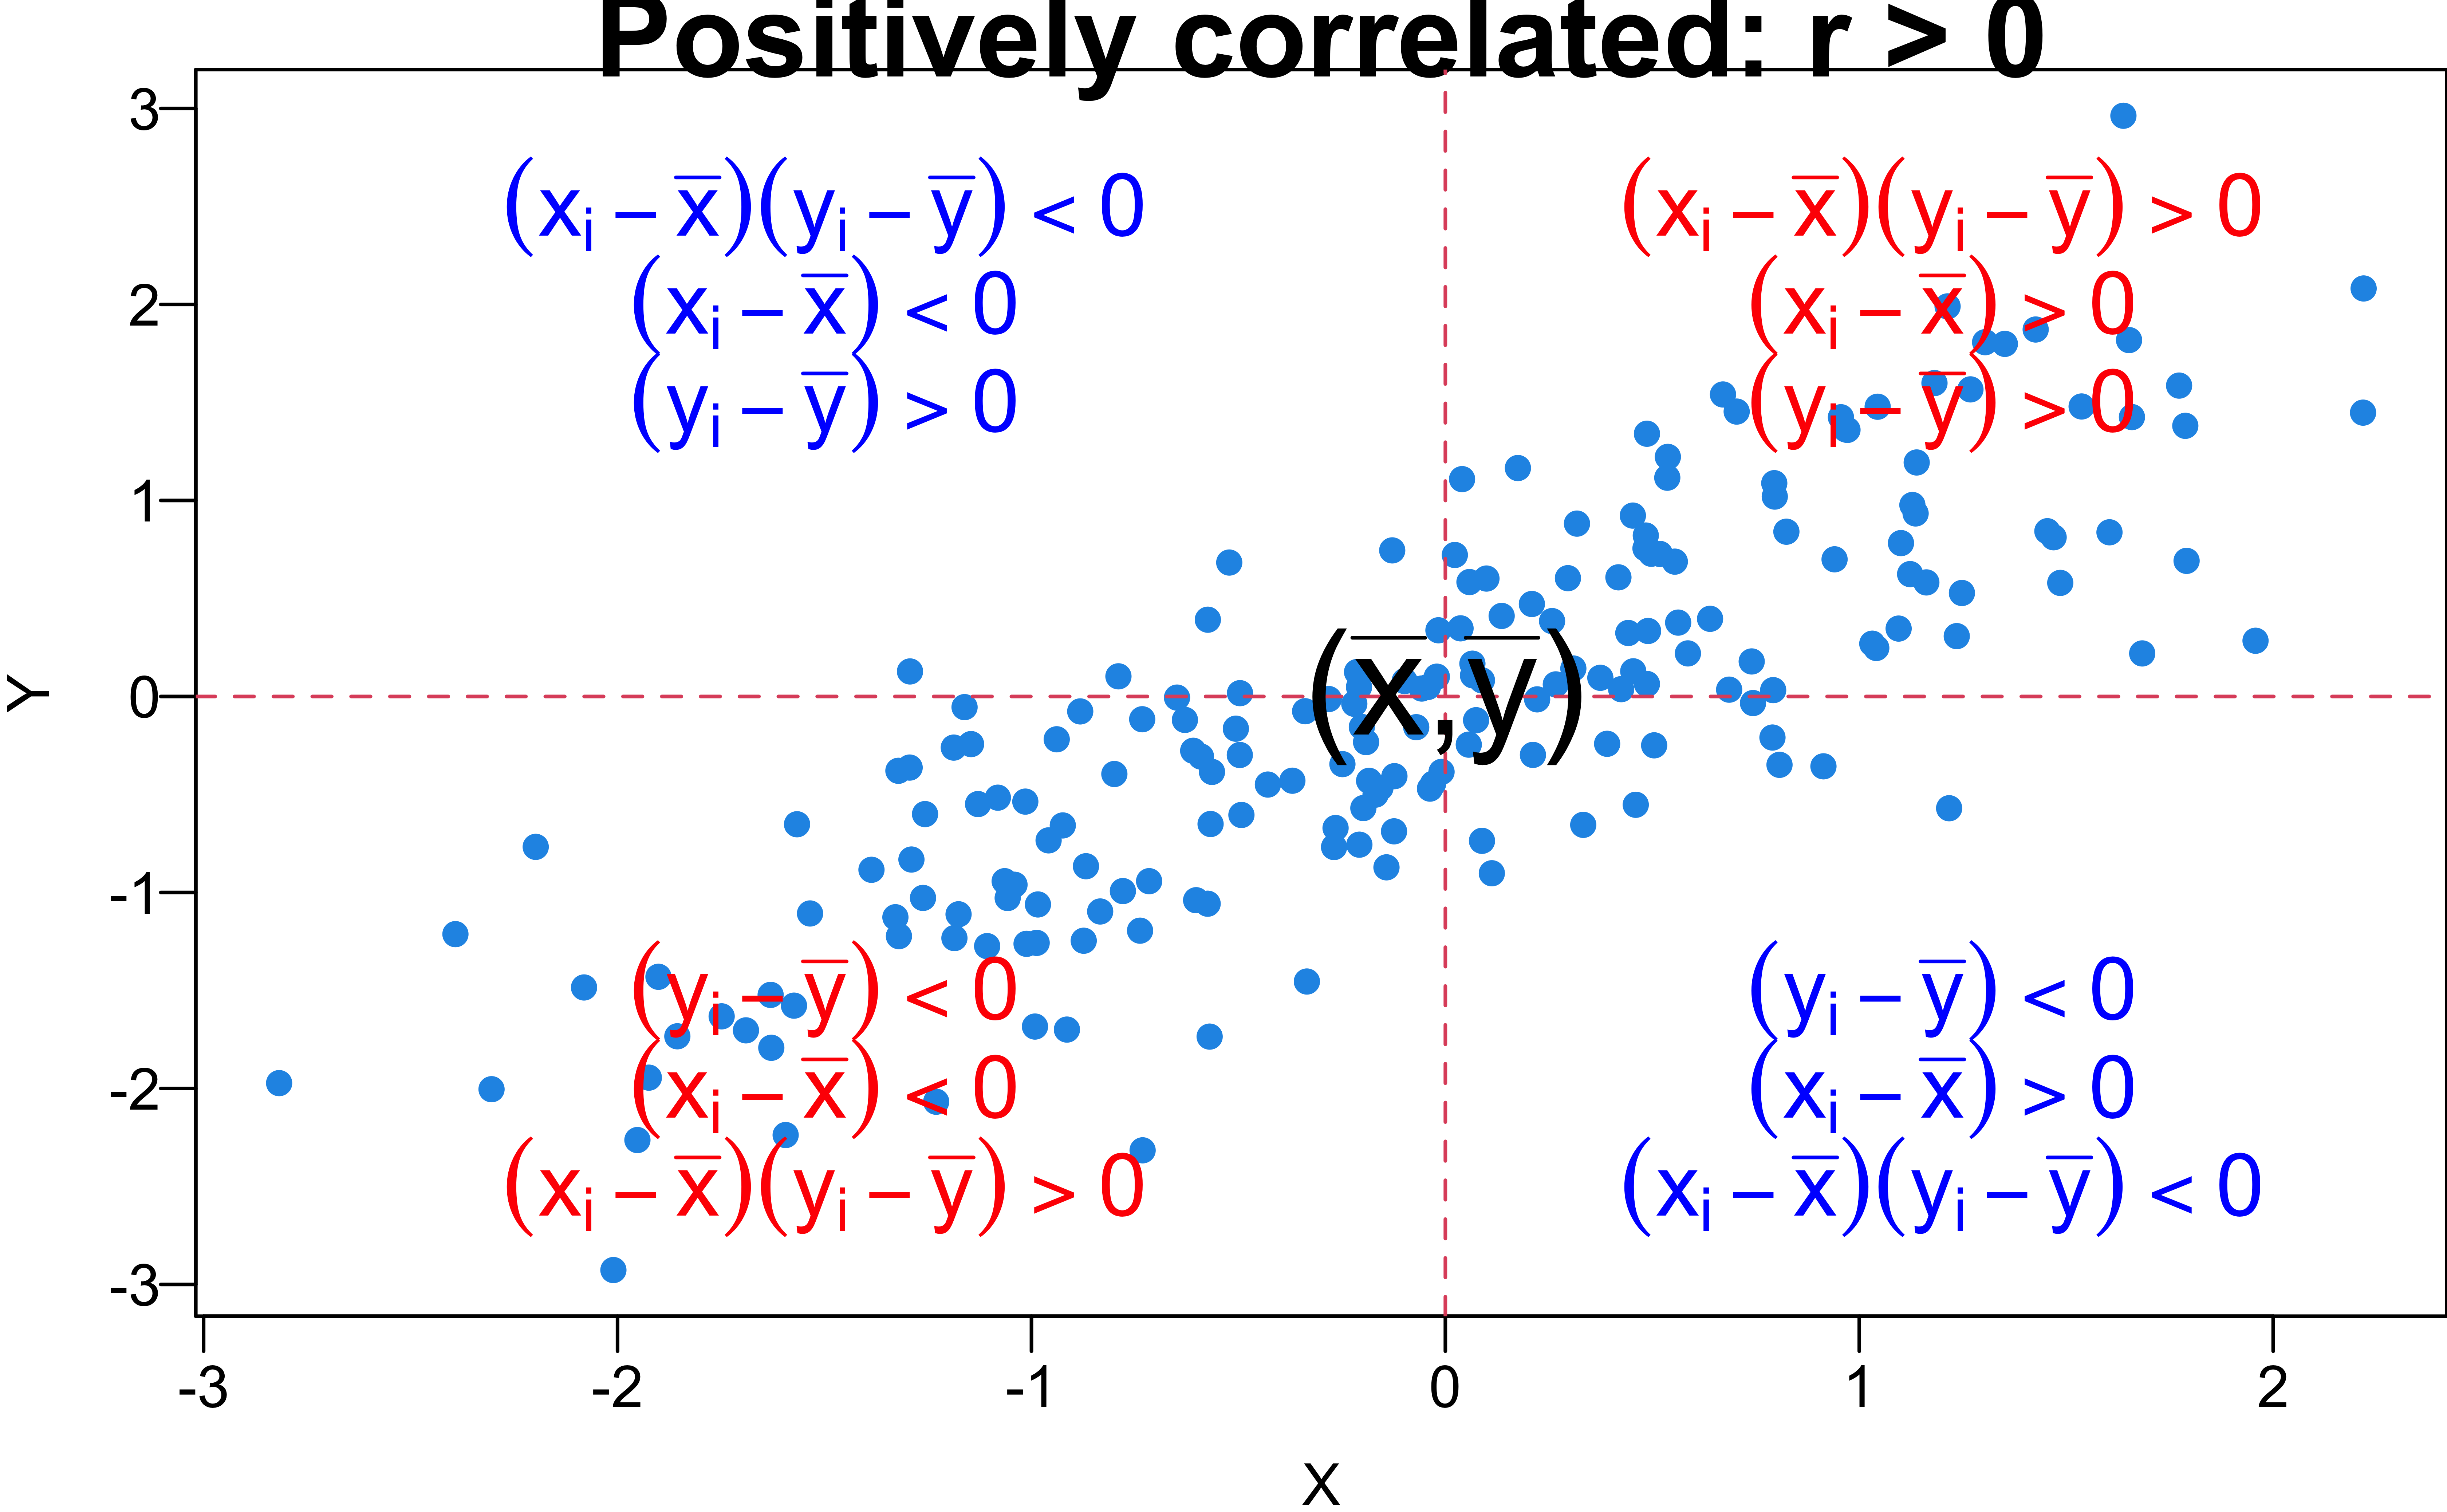
- The sample correlation coefficient, denoted by \(r\), measures the direction and strength of the linear relationship between two numerical variables: \[\small r :=\frac{1}{n-1}\sum_{i=1}^n\left(\frac{x_i-\overline{x}}{s_x}\right)\left(\frac{y_i-\overline{y}}{s_y}\right)\]
- \(-1 \le r\le 1\)
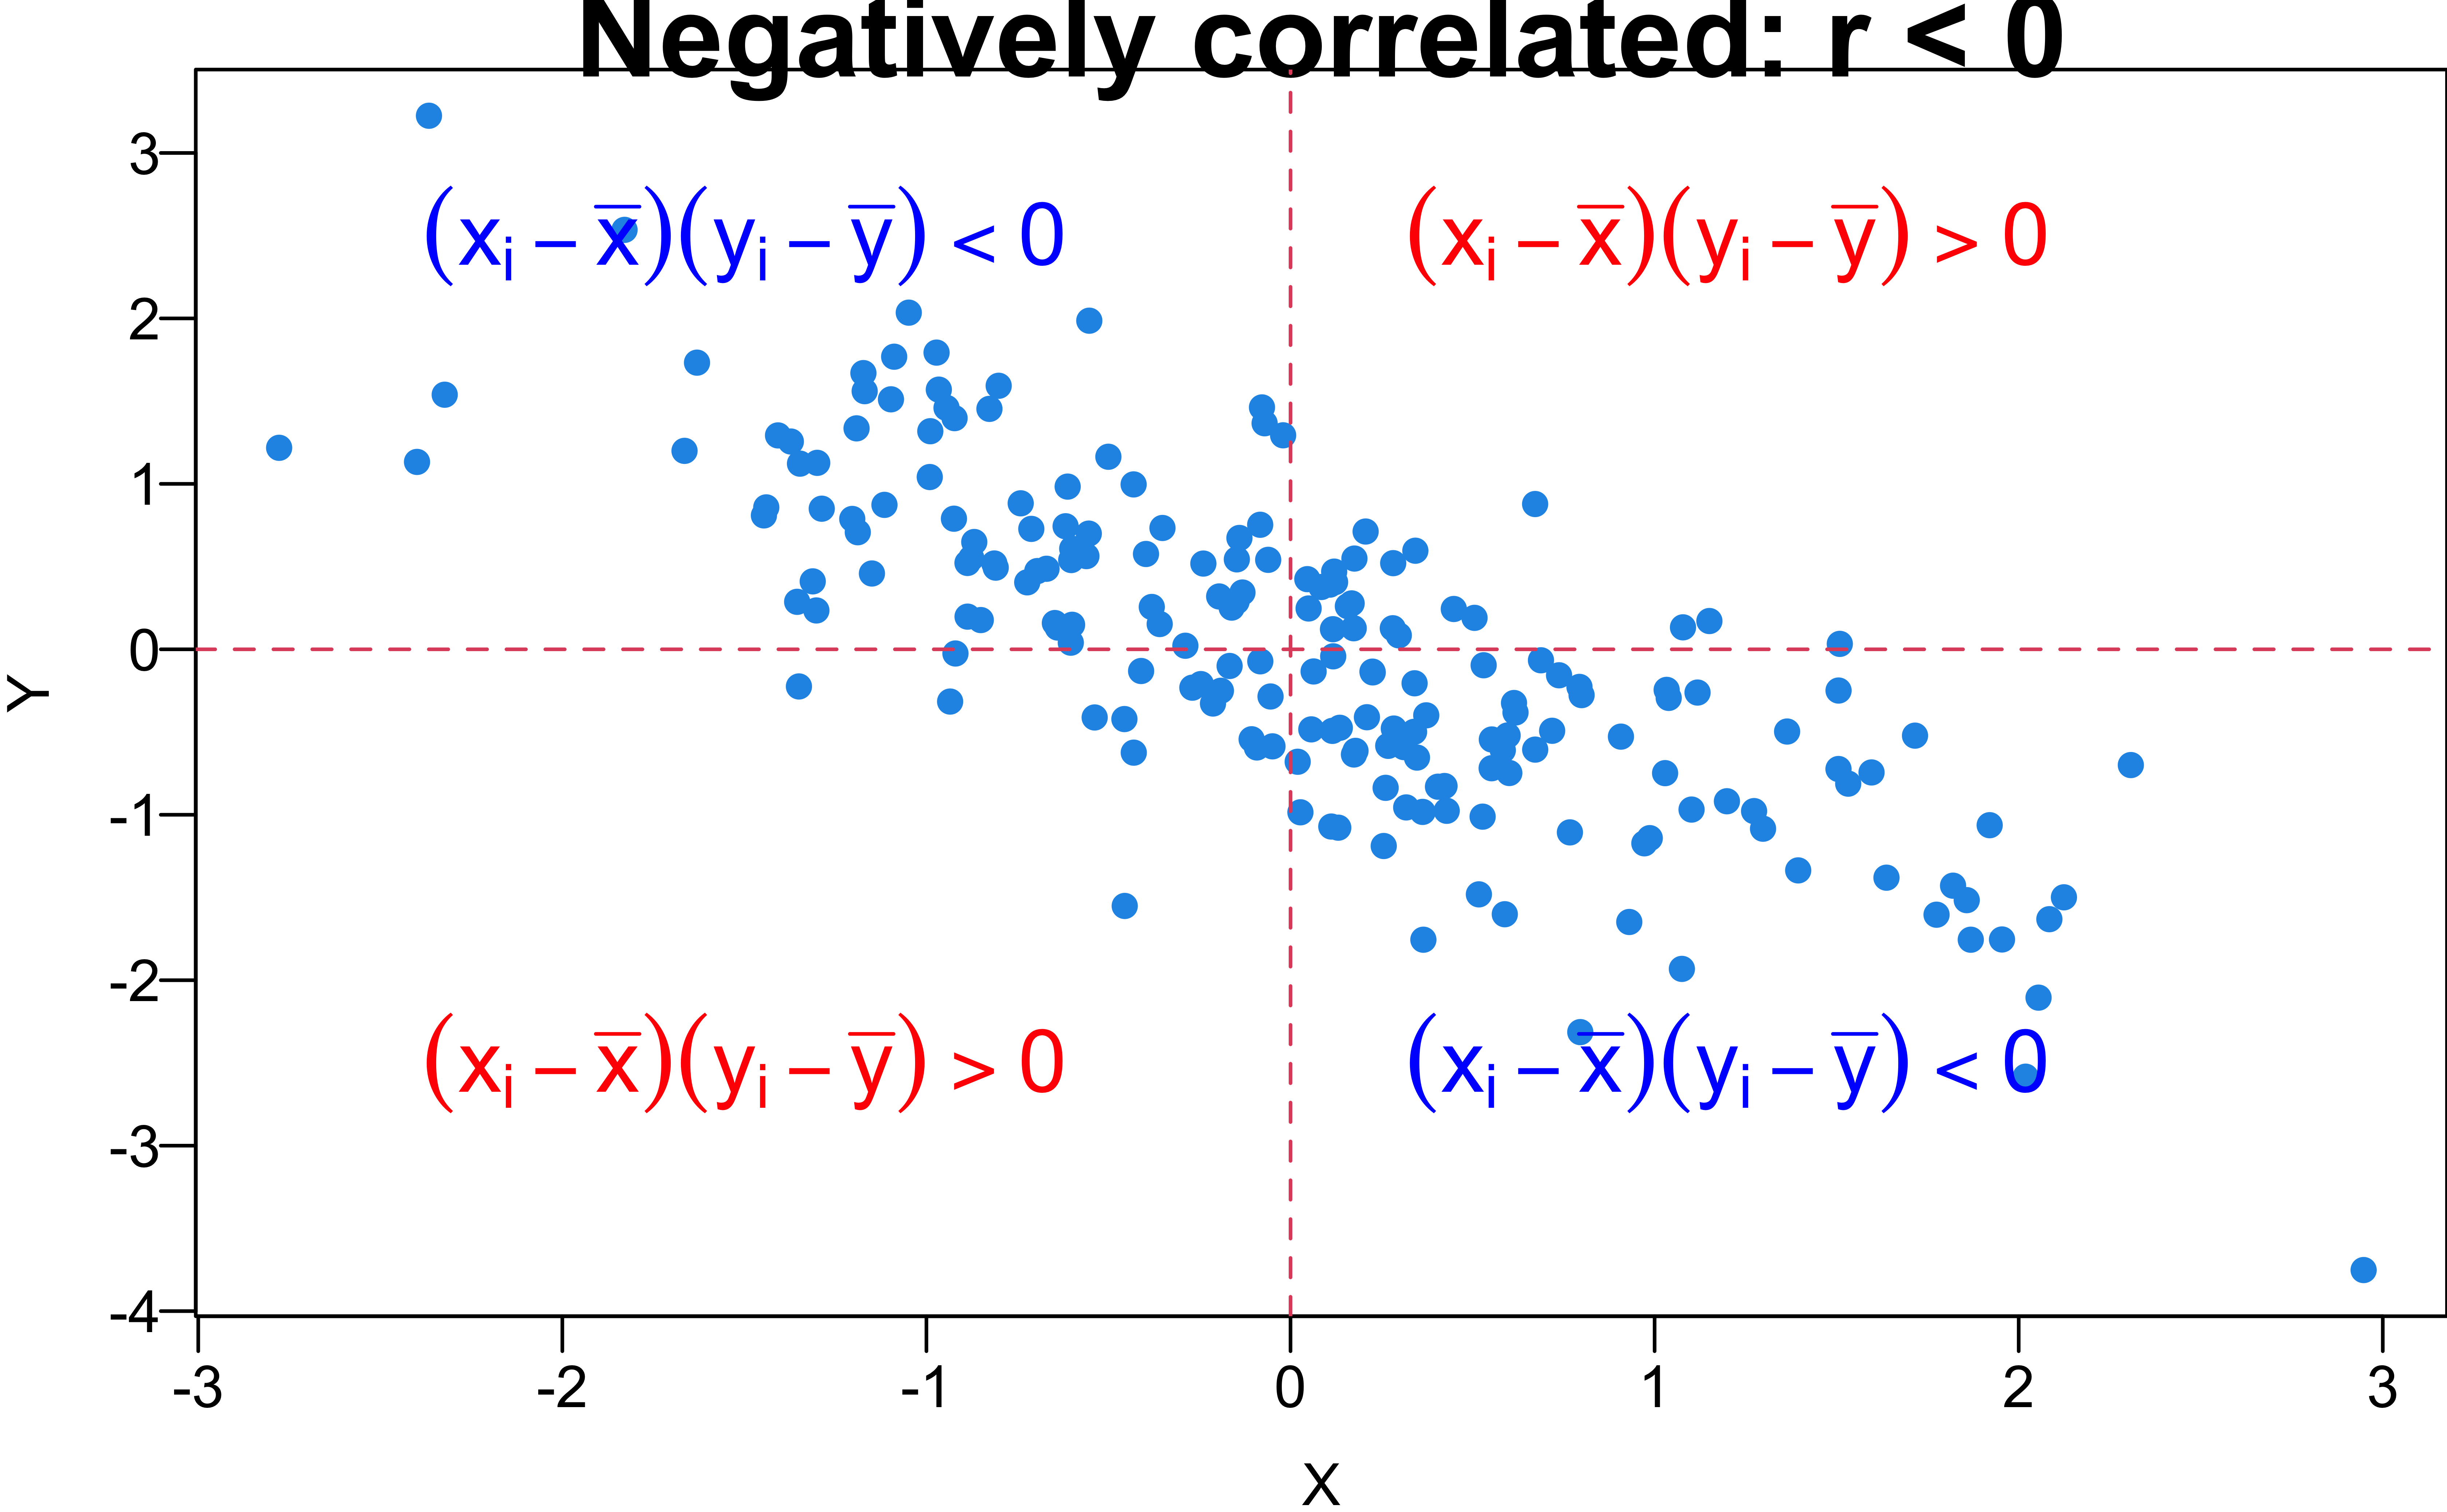
- \(r < 0\): The larger value of \(X\) is, the smaller value of \(Y\) tends toward.
- \(r = -1\): Perfect negative linear relationship.
Linear Correlation Coefficient
- The sample correlation coefficient, denoted by \(r\), measures the direction and strength of the linear relationship between two numerical variables: \[\small r :=\frac{1}{n-1}\sum_{i=1}^n\left(\frac{x_i-\overline{x}}{s_x}\right)\left(\frac{y_i-\overline{y}}{s_y}\right)\]
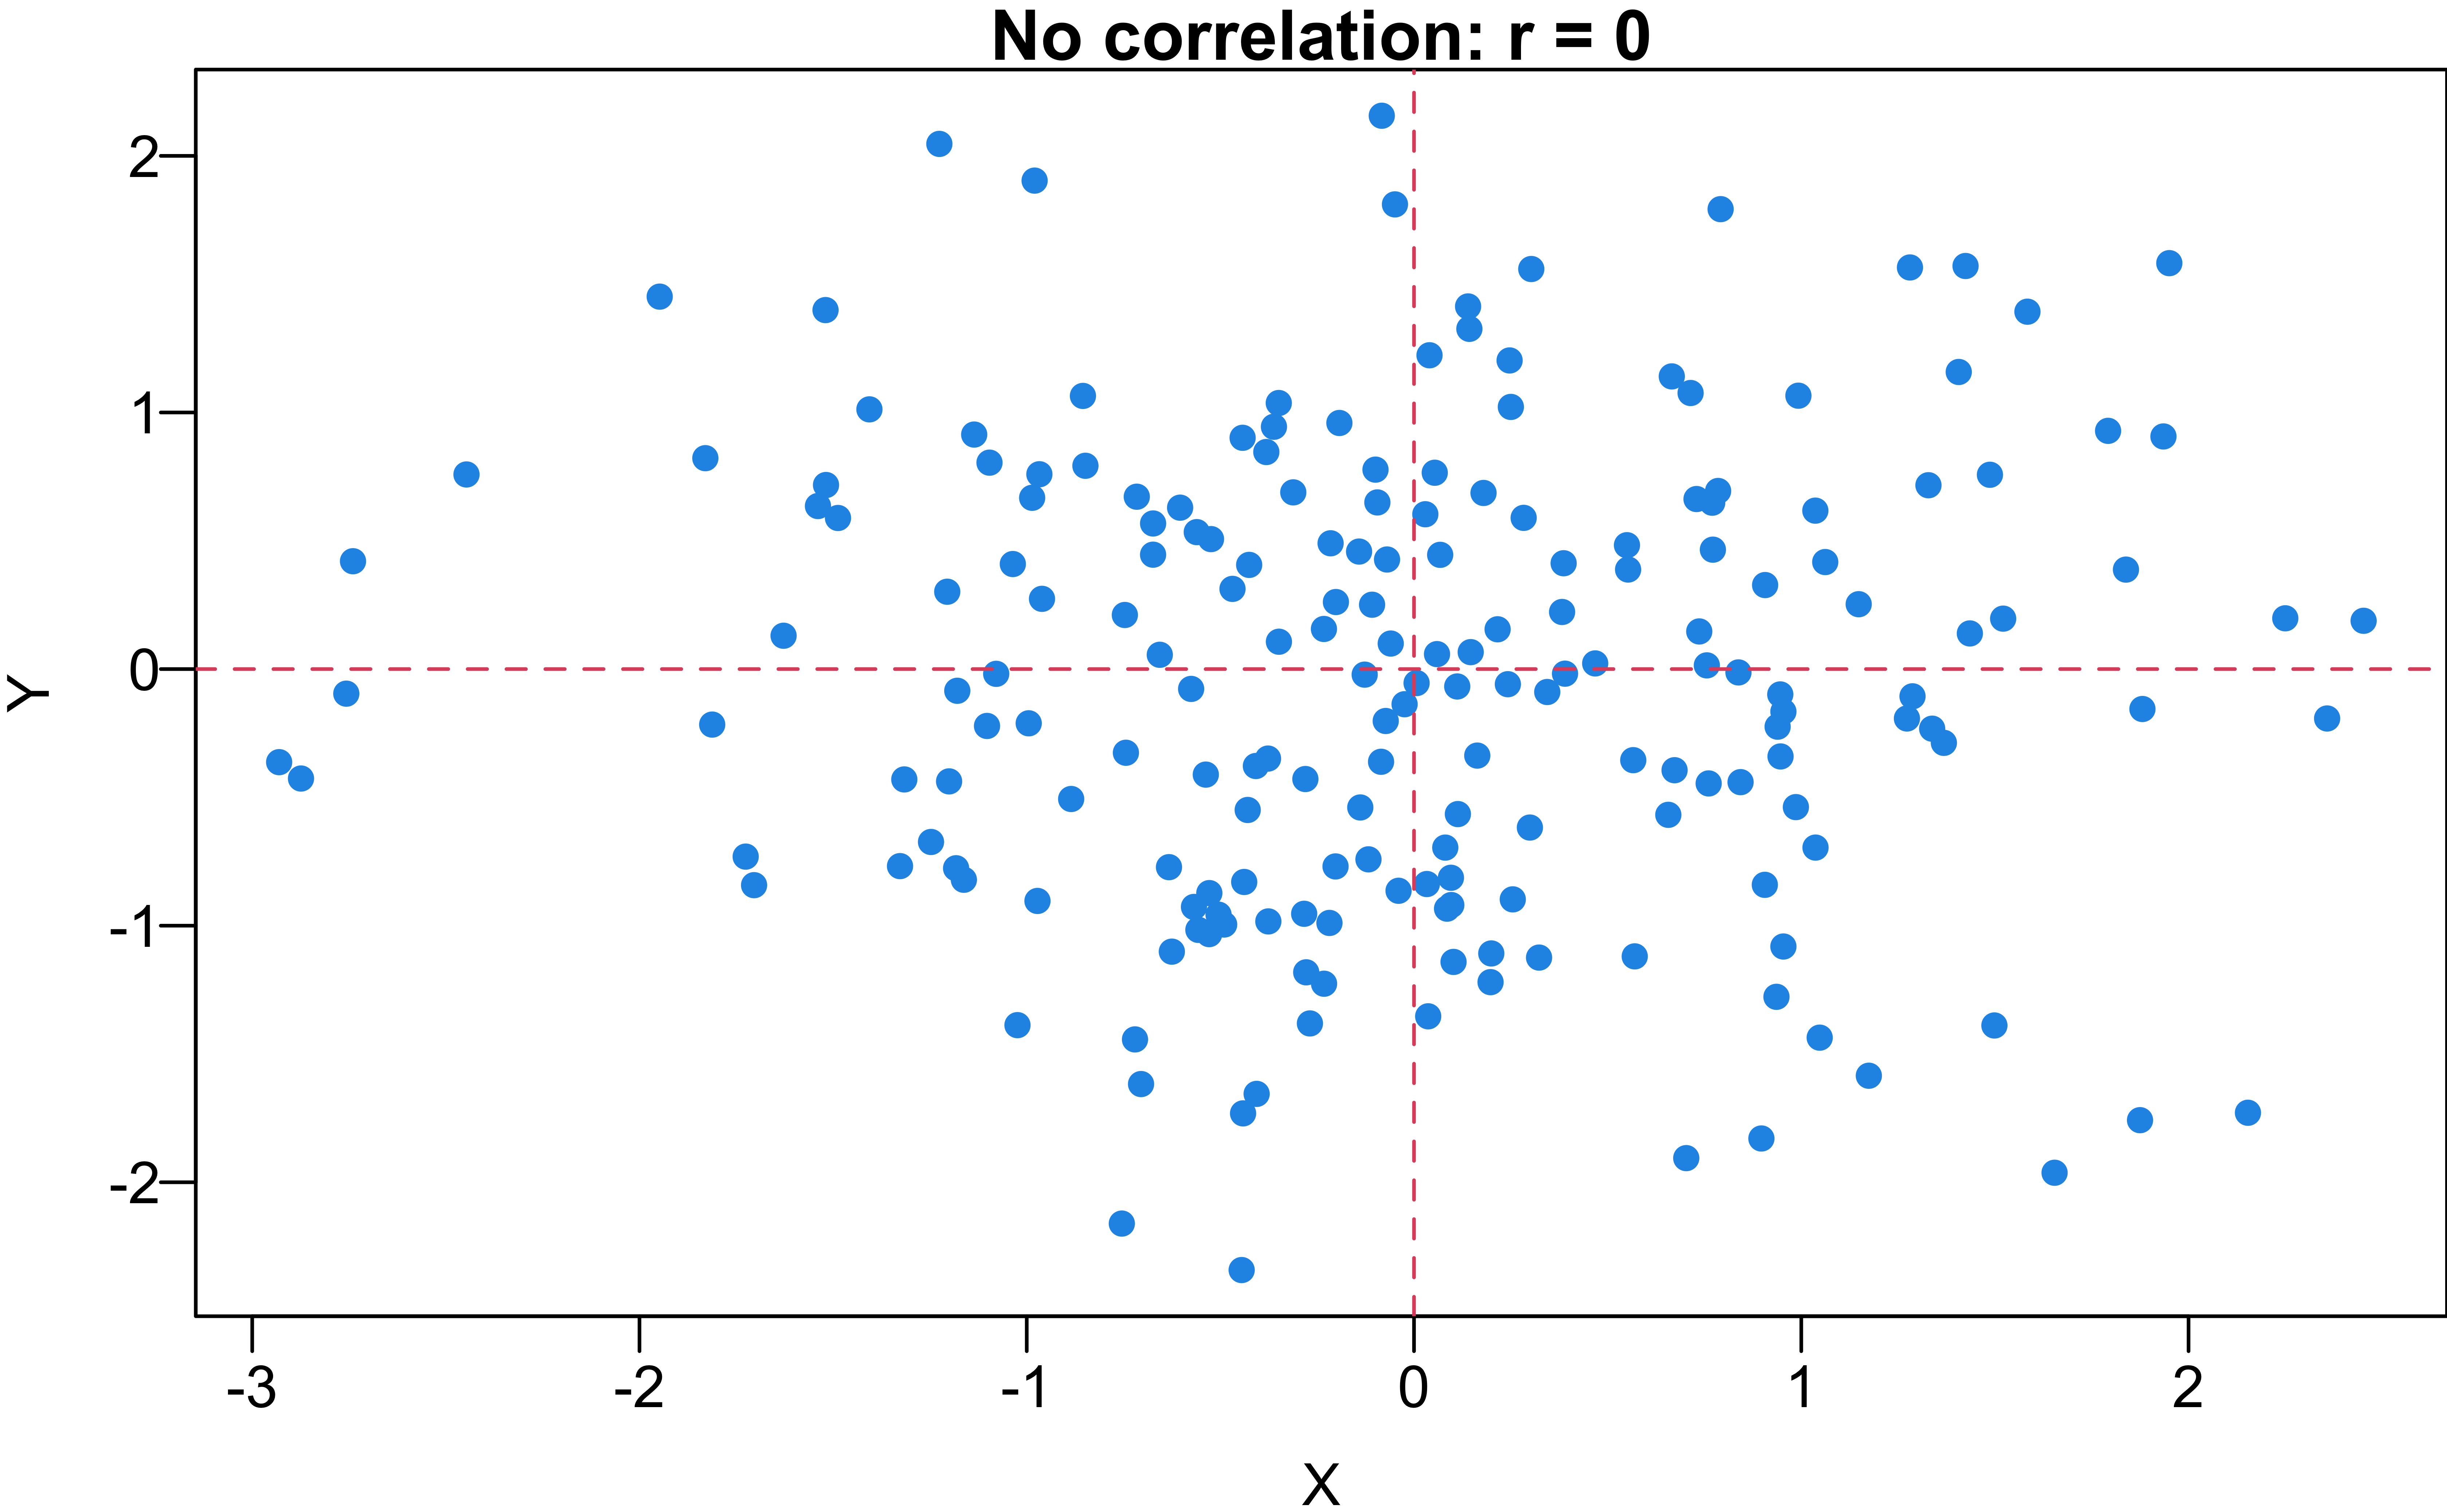
- \(r = 0\): No linear relationship.
- If explanatory and response are switched, \(r\) remains the same.
- \(r\) has no units of measurement, so scale changes do not affect \(r\).
Correlation Example
- It is possible that there is a strong relationship between two variables but still \(r = 0\).

Example in R
plot(x = mtcars$wt, y = mtcars$mpg,
     main = "MPG vs. Weight",
     xlab = "Car Weight",
     ylab = "Miles Per Gallon",
     pch = 16, col = 4, las = 1)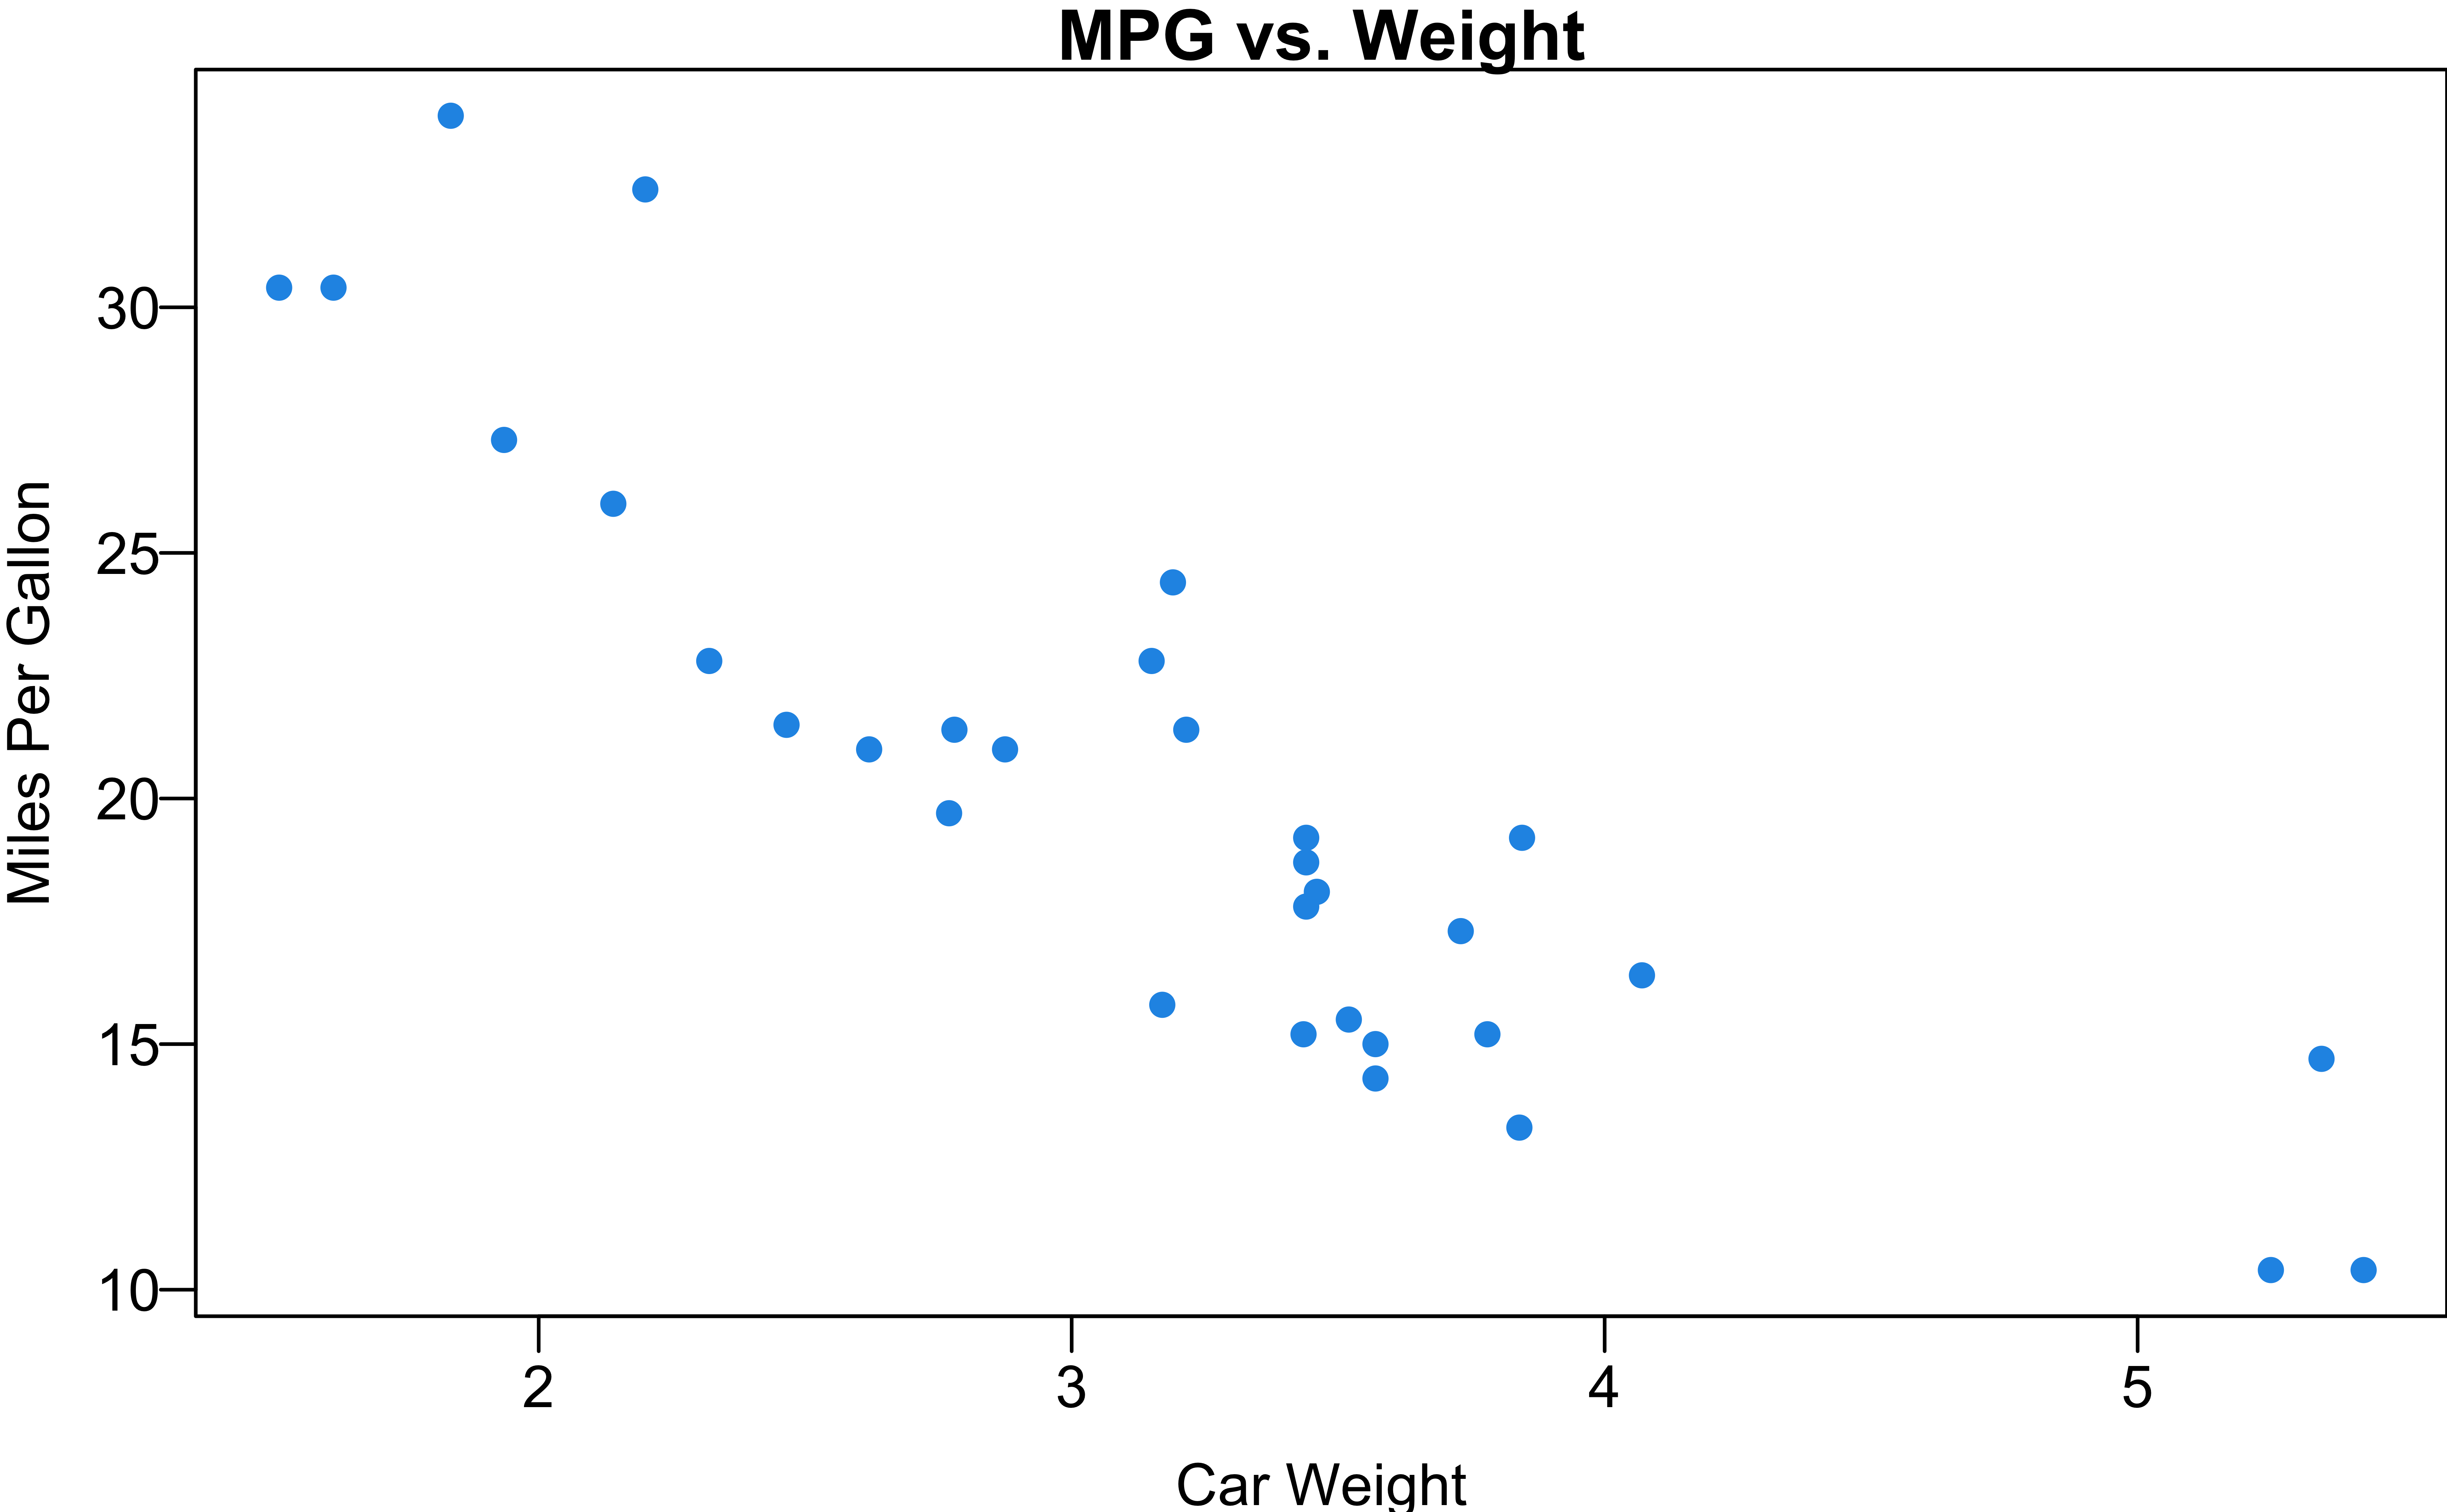
cor(x = mtcars$wt,
    y = mtcars$mpg)
[1] -0.87